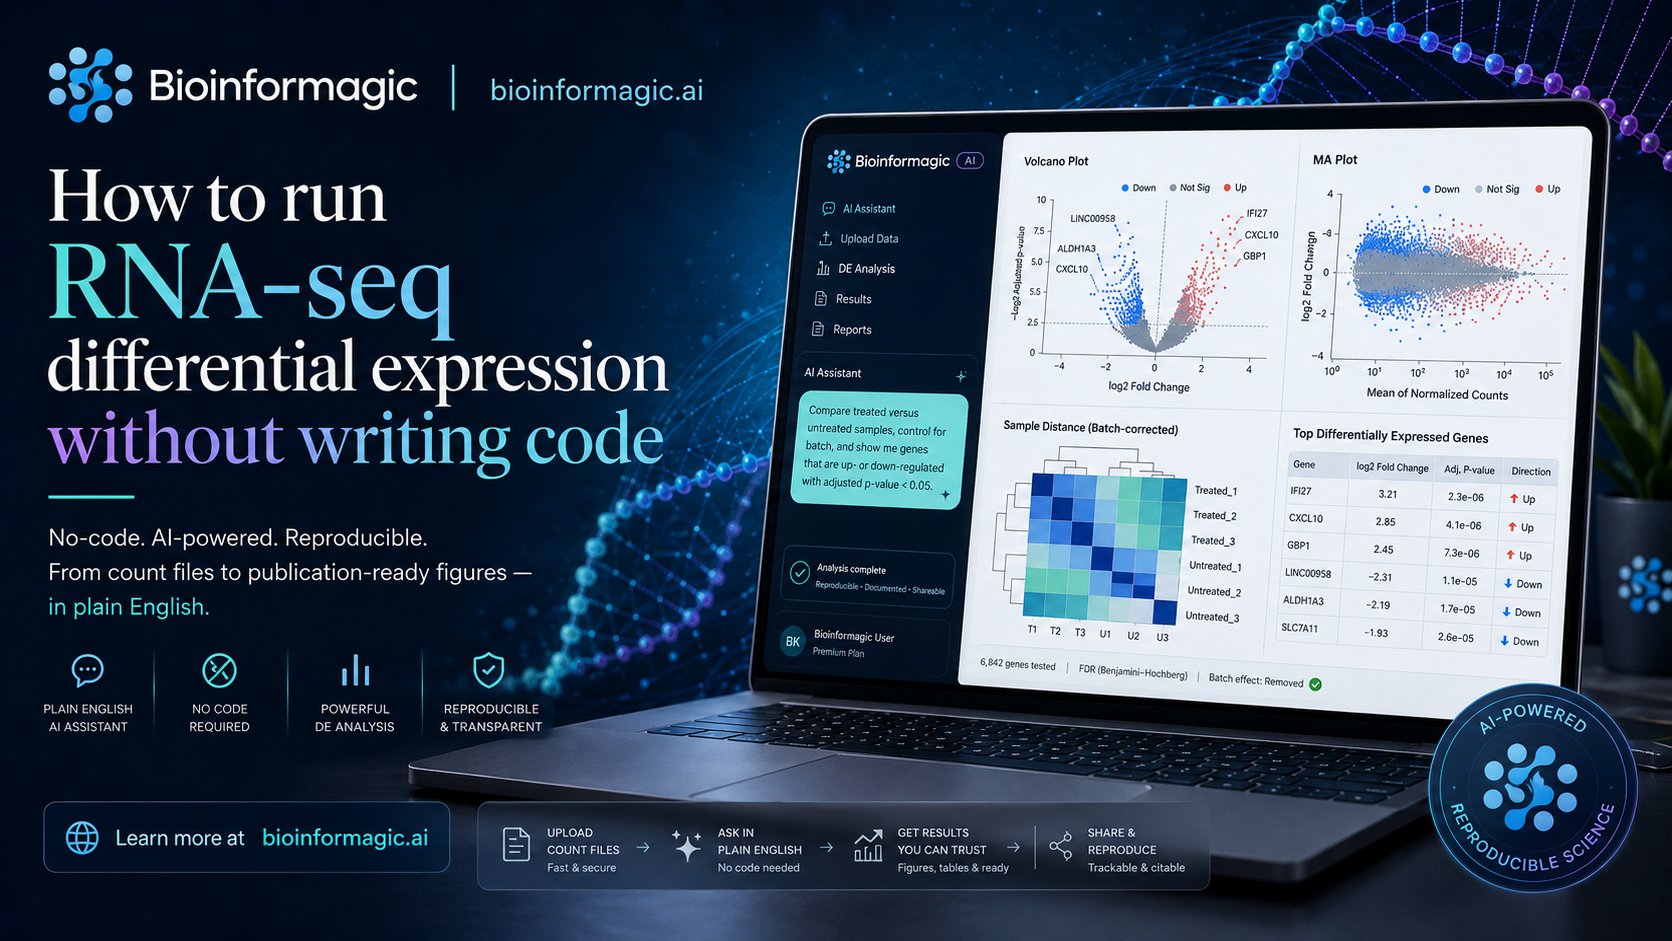
Single-cell RNA-seq is one of the most rewarding analyses in modern biology and one of the most intimidating to run. It isn't a single command; it's a sequence of judgement calls, each with knobs that change the final picture.
The promise of plain-English analysis isn't that those judgement calls disappear. It's that you get to make them as a biologist, in words, instead of as a programmer, in code.
The single-cell pipeline, in plain terms
- Quality control. Filter empty droplets, dying cells and doublets. Decide thresholds for genes-per-cell and mitochondrial content.
- Normalisation & feature selection. Make cells comparable and pick the genes that carry signal.
- Dimensionality reduction & clustering. Run PCA, build a neighbour graph, cluster, and project to a UMAP.
- Annotation. Assign cell-type labels from marker genes.
- Visualisation. Produce the UMAPs, dot plots and marker heatmaps your paper needs.
Where natural language fits
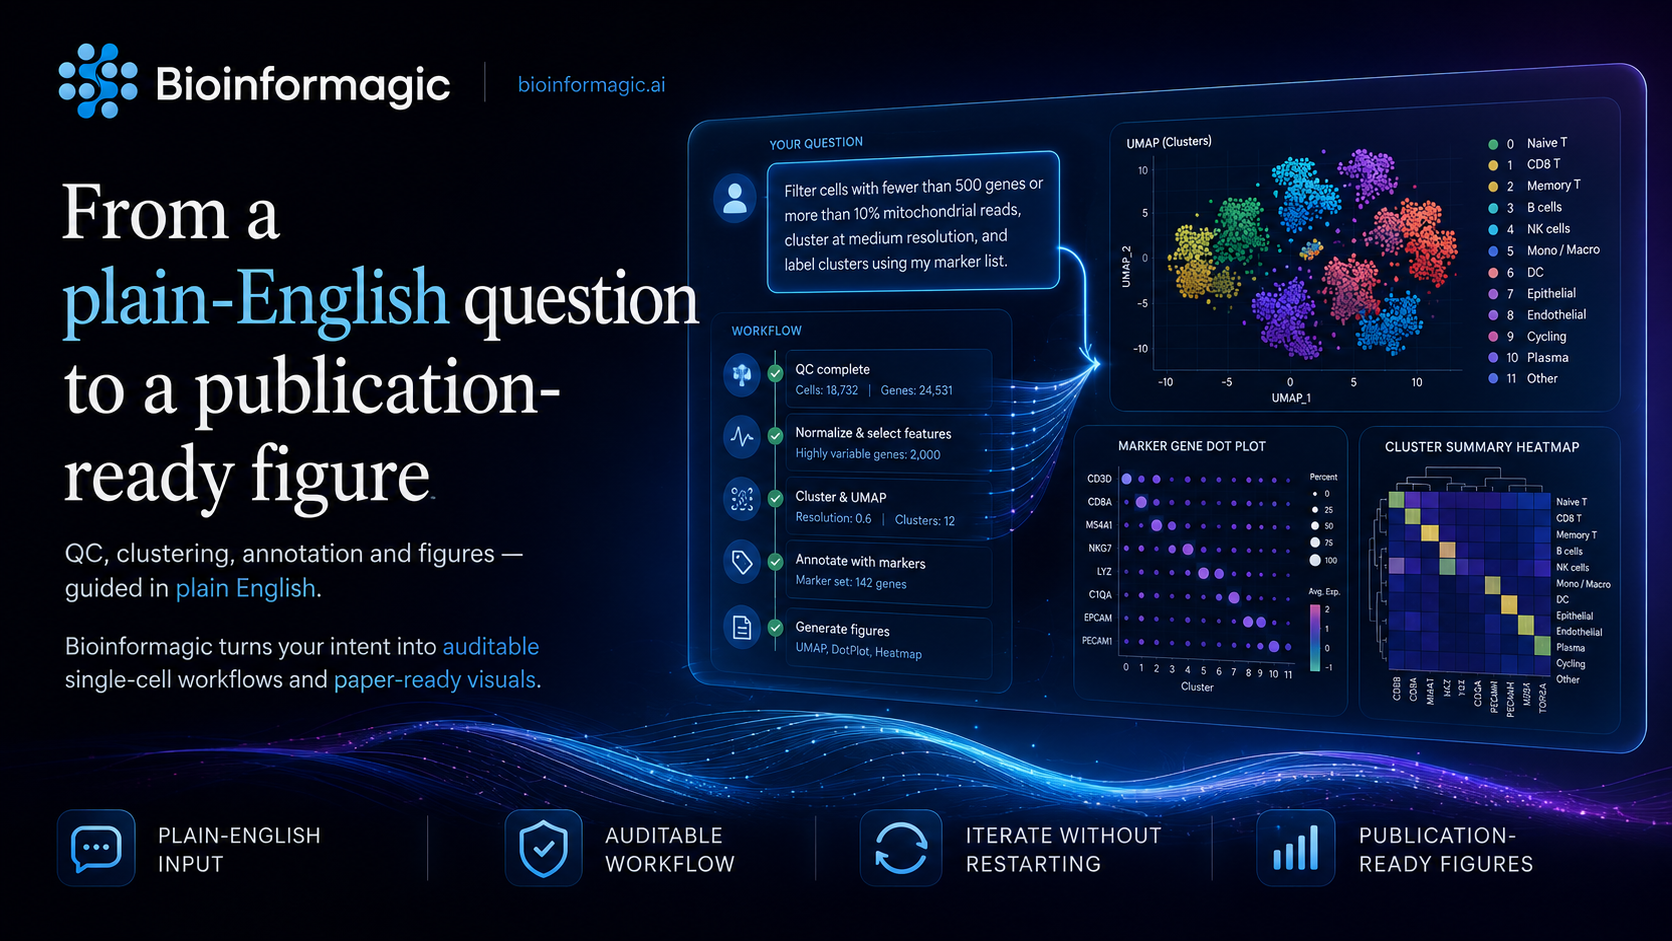
Each step above maps cleanly onto something you can say out loud:
Filter cells with fewer than 500 genes or more than 10% mitochondrial reads, cluster at medium resolution, and label clusters using my marker list.
Bioinformagic turns that into the corresponding Scanpy/Seurat-style steps, shows you the parameters it chose, and lets you nudge any of them. Want a higher clustering resolution? Say so, and only that step re-runs.
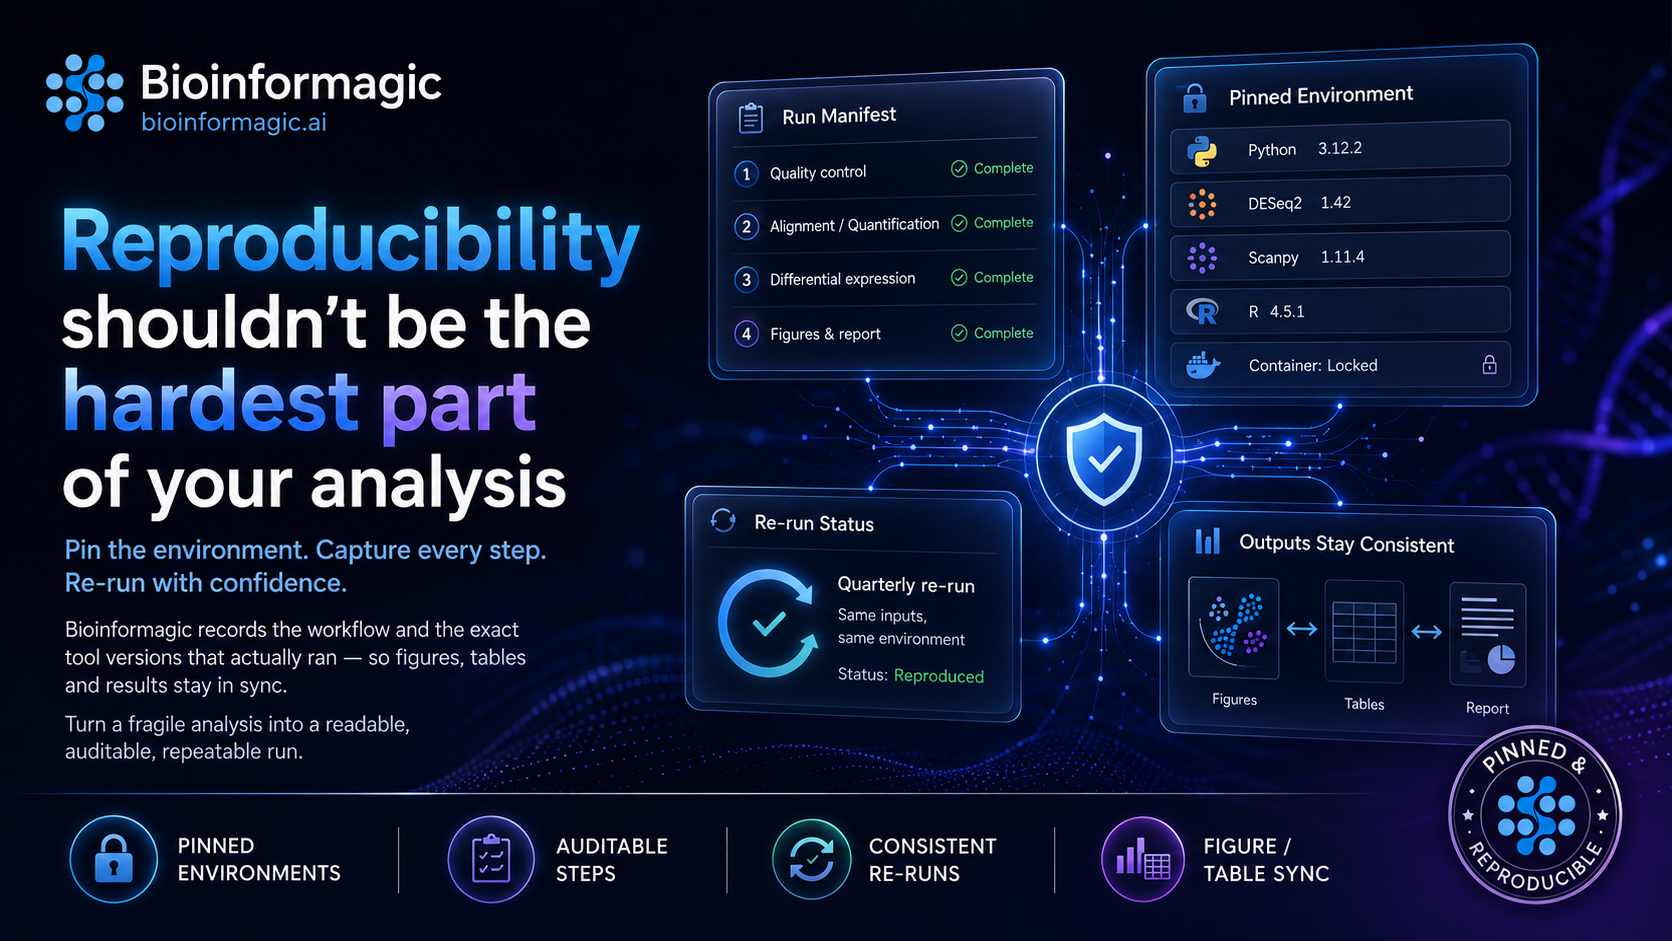
Auditable by construction
Every decision is recorded as a readable step, not buried in a notebook you'll never reopen. When a reviewer asks "how did you define this cluster?", the answer is right there — the threshold, the markers, the resolution — in plain language and in the underlying code.
Iteration without starting over
The reality of single-cell work is that you run it more than once. You tweak QC, re-annotate, and re-make figures as your understanding sharpens. Because each step is captured and cached, changing one thing doesn't mean re-running everything — and it doesn't mean your figures silently drift out of sync with your numbers.
Figures you don't have to redraw
The output is meant to be the figure you'd submit, not a rough draft you then rebuild by hand: labelled UMAPs, marker dot plots, and per-cluster summaries, all regenerated from the same pinned workflow. Consistent colours, consistent labels, consistent story.
Bring your trickiest dataset
Single-cell is exactly the kind of multi-step analysis this approach was built for. Request early access and try it on a dataset you've already published — comparing the labels is the quickest sanity check we know.